TaurusPlot User’s Interface
Todo
These docs need to be updated to the taurus_pyqtgraph implementation
The standard way for Taurus applications to show one-dimensional data is by
using a TaurusPlot widget.
TaurusPlot is shown as an area with X and Y axes where curves (data sets)
are plotted. It may also show a legend.
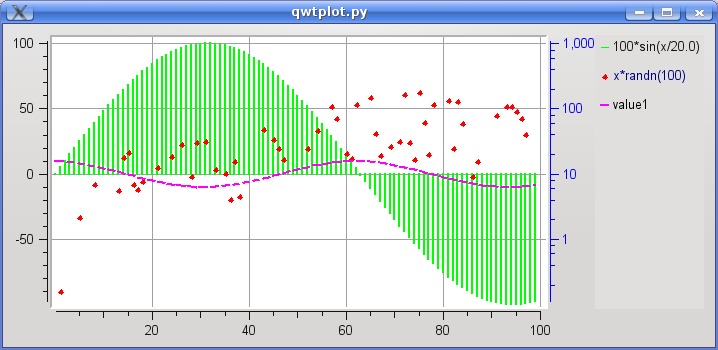
But the TaurusPlot does a lot more than just showing a plot. It allows
the user to interact with the plot in many ways as described below.
Note
The features described here are available by default in all TaurusPlot widgets, but certain GUIs may choose to disable some of these features.
TaurusPlot as a Stand-alone application
You may also use TaurusPlot as a stand-alone application for displaying
attributes from the control system or for plotting a function. You can launch the
stand-alone TaurusPlot with the following command:
taurus plot [options] [<model_list>]
Run the following command for more details:
taurus plot --help
The <model_list> is a space-separated list of models for TaurusPlot.
See TaurusPlot API for more information about valid models
Working with two Y scales
A TaurusPlot has a X axis and one or two Y axes (left and right, also
called Y1 and Y2, respectively).
Multiple curves can be displayed simultaneously and each one will be associated
to either Y1 or Y2.
By default, TaurusPlot only shows a legend when more than one curve is displayed
(this behavior can be overridden using the TaurusPlot context menu).
You can change the axis to which a curve is associated using the Plot Configuration dialog.
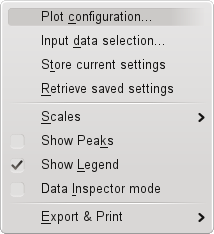
TaurusPlot context menu
Most of the options of a TaurusPlot can be managed from a context menu that is
shown when right clicking on the plot area:
Right-clicking on an axis will show a context menu with the specific options for that axis.
Zooming and panning
There are several ways of changing the scales interactively:
The plots can be zoomed in and out by holding the right mouse button and moving the mouse. Using the wheel mouse is also allowed. For Zooming on an specific axis, do those actions over the specific axis.
Panning (i.e. translating without scaling) is done by holding the middle mouse button and moving the mouse.
The small “A” icon on the bottom-left corner of the plot resets the zooms and returns to auto-scale mode.
Finally, all details about the scales are accessible at the axis submenus from the TaurusPlot context menu.
Plot Configuration dialog
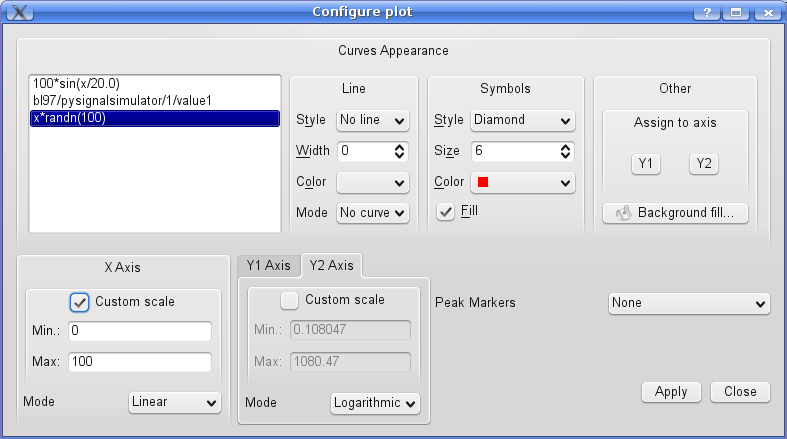
This dialog can be accessed from the TaurusPlot context menu.
On its top section you can customize the look of the displayed data (line type, symbols used, colors, thicknesses, associated axis,…). Any changes will be applied to all the curves selected from the list on the left.
The curve titles can be changed by editing them directly in the list (one by one).
Choosing what is plotted
When TaurusPlot is used in a GUI, it is likely that some data is
already plotted on it. But it is possible to add other data: use the
Model selection option from the TaurusPlot context menu.
Storing and recovering current configuration
Once you have customized the way the plot looks (see the Plot Configuration dialog section), you may want to save the settings for later use. This can be done using the Save current settings option from the TaurusPlot context menu.
This will save which curves should be plotted and how they should look.
You can restore those settings at any point by using the retrieve current settings option from the TaurusPlot context menu.
Obtaining information about the plotted values
Sometimes you want to know more about the values being plotted. The following features can be useful:
Data Inspector: you can inspect the value of any given data point by entering in Inspector mode. You canenable it via the TaurusPlot context menu .
Exporting and printing the data
You want a figure for a logbook?
Or you want to store the plotted values in a file?
Then you will like the Export capabilities of TaurusPlot (accessible from the TaurusPlot context menu ). From this action you can export into various image and data formats:
Customizing the titles of the curves
The titles of the curves (which are displayed in the legend) can be customised in several ways:
Through the Change Curves Titles… option in the TaurusPlot context menu
Through the Plot Configuration dialog (either editing the name individually, or selecting several curves and clicking on the Curve Title(s)… button)
Date/time support
In some applications, the values of the X axis are interpreted as date/time values (this is set by using the -xt parameter when launching TaurusPlot from the command line).
In this mode, the values of the abscissas must be valid epoch numbers, i.e. seconds since the “beginning of times” (UNIX t=0 : 1970-01-01 01:00:00). TaurusPlot will interpret such values and display well-formatted dates and times instead of the epoch number: