Plotting with Taurus
Note
Some details in this page originate from the legacy plotting widgets
and may not exactly match the current taurus_pyqtgraph interface.
The standard way for Taurus applications to show one-dimensional data is by
using a TaurusPlot widget.
TaurusPlot is shown as an area with X and Y axes where curves (data
sets) are plotted. It may also show a legend.
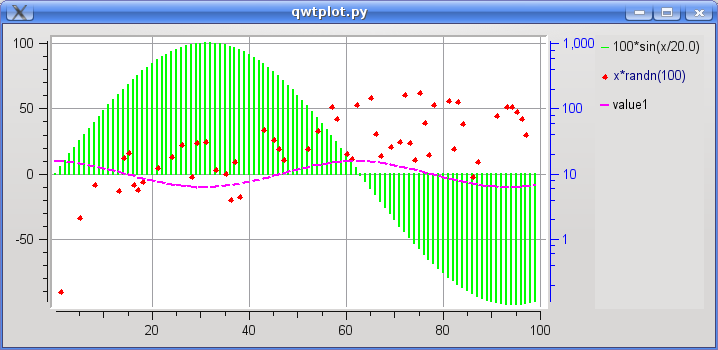
A TaurusPlot does more than displaying a plot. It also provides tools
for interacting with the displayed data and configuring its representation.
Note
The features described here are available by default in all TaurusPlot widgets, but certain GUIs may choose to disable some of these features.
Two Y scales
A TaurusPlot has an X axis and one or two Y axes (left and right, also
called Y1 and Y2, respectively). Multiple curves can be displayed
simultaneously and each one is associated with either Y1 or Y2.
By default, TaurusPlot only shows a legend when more than one curve is
displayed.
The axis associated with a curve can be changed from the plot configuration. See Work with TaurusPlot for task-oriented instructions on configuring a plot.
Date/time support
In some applications, the values of the X axis are interpreted as date/time values. In this mode, the values of the abscissas must be valid epoch numbers, i.e. seconds since the UNIX epoch.
TaurusPlot interprets such values and displays formatted dates and times instead of the epoch number:
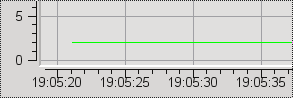
When launching TaurusPlot from the command line, this mode can be selected with
the -x t option. See Work with TaurusPlot for more information about
using TaurusPlot.
Plotting backends
Taurus uses different plotting backends for its plotting widgets:
plotpy provides
TaurusImageDialogandTaurusTrend2DDialog, implemented intaurus.qt.qtgui.extra_plotpy.pyqtgraph is used by the
TaurusPlotandTaurusTrendimplementations provided by the taurus_pyqtgraph plugin. This replaced the PyQwt5-based implementations that were available in Taurus versions before 5 (see TEP17).
For applications using the taurus_pyqtgraph plugin, Taurus functionality is intended to extend regular pyqtgraph widgets. The pyqtgraph documentation and examples are therefore useful together with the Taurus-specific plugin examples.