Trends and 2D trends
Note
Some details in this page originate from the legacy plotting widgets
and may not exactly match the current taurus_pyqtgraph interface.
The TaurusTrend widget is the standard way for Taurus applications to
graphically show the evolution of one or more scalar attributes from the
control system.
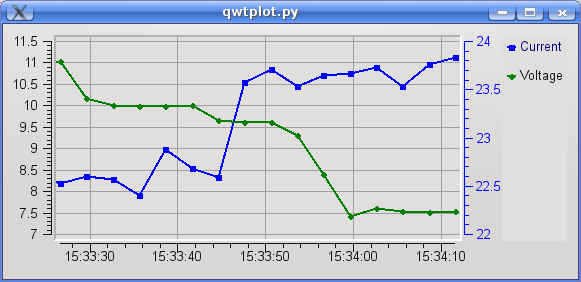
The value of the scalar attributes is plotted on a Y axis with an incrementing X value each time an event from the attribute is received. The X value can either represent an event number or a timestamp.
TaurusTrend has many features in common with taurus_pyqtgraph.TaurusPlot.
See Plotting with Taurus for the general plotting concepts and
Work with Taurus trends for task-oriented instructions.
Timestamp versus event number
When TaurusTrend receives an event from an attribute, it plots the attribute value against either:
the sequential order of arrival of the event (the event number), or
the timestamp associated with this value. See Date/time support for more information about date/time values.
When TaurusTrend is part of a GUI, this behavior is set by that GUI. When it is
used as a standalone application, it is selected through the -x parameter.
Timestamp mode is generally the most used one, but the timestamps are only as accurate as the distributed control system allows. Not all attributes are necessarily controlled by a centralized high-accuracy clock.
Using a spectrum as a collection of scalar values
TaurusTrend plots the evolution of scalar values. However, 1D attributes are sometimes used by the control system as a way of packing a set of scalar values together.
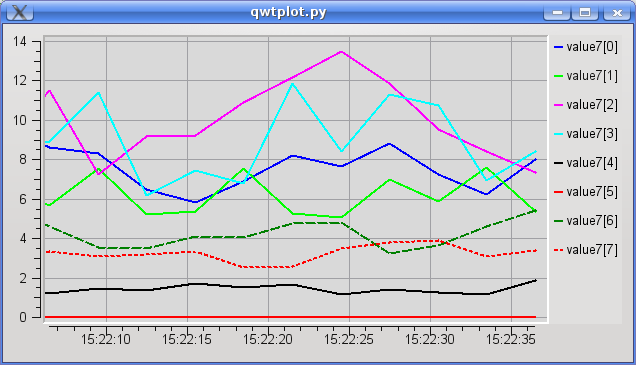
For this reason, TaurusTrend can plot a 1D attribute assuming that each item in the spectrum is an independent scalar number. For example, a 1D attribute of length 8 is plotted as 8 separate curves.
All curves belonging to the same SPECTRUM attribute are updated simultaneously, since events are received per attribute.
Timing limitations when comparing attributes
If two different attributes are plotted in the same trend, their times may appear slightly out of sync. For example, two parameters that are known to vary simultaneously may appear to be 0.5 seconds apart.
This happens because TaurusTrend relies on the control-system timestamps for assigning time values, so its precision is limited by that of the control system for the given parameters.
An attribute timestamp may be assigned using the internal clock of the machine hosting its device server. Attributes managed by different machines can therefore only be compared to the extent that those clocks are synchronized. Keeping the machines synchronized is highly recommended, for example using NTP.
Trend of Tango State and other non-numerical attributes
The Tango State attribute is a special attribute whose value is one of a set of discrete states.
taurus trend is not directly compatible with State attributes. A trend can
instead be built by exposing a numerical value through a
taurus.core.evaluation model. See Work with Taurus trends for examples.
2D trends
The TaurusTrend2DDialog widget is the standard way for Taurus
applications to graphically show the evolution of a one-dimensional attribute.
The representation is a spectrogram: time (or event number) is represented on
the X axis while values of the array are color-coded along the Y axis.
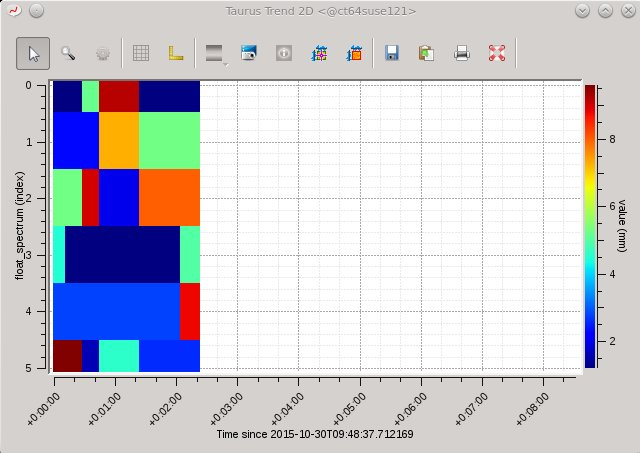
Several tools from the standard plotpy toolkit for images are available, and zooming and panning use the standard plotpy mechanisms.