Work with Taurus trends
This guide covers common tasks specific to TaurusTrend and
TaurusTrend2DDialog. For the concepts behind trends, see
Trends and 2D trends.
Note
Some details in this page originate from the legacy plotting widgets
and may not exactly match the current taurus_pyqtgraph interface.
Launch TaurusTrend as a standalone application
Launch TaurusTrend with:
taurus trend [options] [<model_list>]
Run the following command for more details:
taurus trend --help
The model list is optional and is a space-separated list of models for
TaurusTrend. Valid models are scalar or 1D attribute names; 1D attributes are
treated as collections of scalars. See the TaurusTrend API for more
information about valid models.
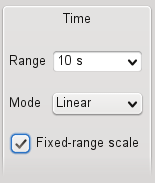
Use a fixed X-axis range
When working with trends, you may only want to see the latest values. For example, you may want the last five minutes in timestamp mode or the latest 20 values in event-number mode.
Switch the fixed-range X-scale mode on or off from either:
the Use the TaurusPlot context menu, under the
Scalessubmenu;the Configure the plot, under the
X axissubmenu, where you can choose a suggested value or enter a range.
Plot a spectrum as separate scalar trends
A 1D attribute can be plotted as a set of independent scalar curves. Add the 1D attribute as a TaurusTrend model in the same way as a scalar model. Each element of the spectrum is then represented by its own curve.
See Trends and 2D trends for the rationale and update behavior of this mode.
Force periodic attribute reads
Some control-system attributes may only send events when their value changes. In a TaurusTrend this can make attributes that change infrequently appear to have been lost.
To force TaurusTrend to periodically re-read the displayed attributes, enable the feature and set its period from the Use the TaurusPlot context menu.
When launching TaurusTrend as a standalone application, the same behavior can
be enabled with the -r option.
Warning
Very frequent re-reads may affect both the control system and GUI performance, especially when several attributes are being plotted. Use this feature only when needed.
Trend a Tango State attribute
taurus trend does not directly support Tango State attributes, but an
evaluation model can expose their numerical representation. For example:
taurus trend -r 500 'eval:state=int({tango:sys/tg_test/1/state});state'
To trend whether the state is MOVING (enumeration value 6):
taurus trend -r 500 'eval:moving=(int({tango:sys/tg_test/1/state})==6);moving'
The same technique can be applied to other non-numerical attributes.
Launch a 2D trend
Launch TaurusTrend2DDialog as a standalone application with:
taurus trend2d <array_attribute_name>
Run the following command for more details:
taurus trend2d --help
For an explanation of the spectrogram representation, see 2D trends.
Access archived values
Archived-value support is outside the Taurus core. See the taurus-tangoarchiving plugin for the corresponding integration.