Work with TaurusPlot
This guide collects common tasks for displaying and interacting with
one-dimensional data using TaurusPlot. For an overview of the plotting
concepts, see Plotting with Taurus.
Note
Some details in this page originate from the legacy plotting widgets
and may not exactly match the current taurus_pyqtgraph interface.
Launch TaurusPlot as a standalone application
You may use TaurusPlot as a standalone application for displaying
attributes from the control system or for plotting a function. Launch it with:
taurus plot [options] [<model_list>]
Run the following command for more details:
taurus plot --help
The <model_list> is a space-separated list of models for
TaurusPlot. See the TaurusPlot API for more information about
valid models.
Use the TaurusPlot context menu
Most options of a TaurusPlot can be managed from a context menu shown
when right-clicking on the plot area:
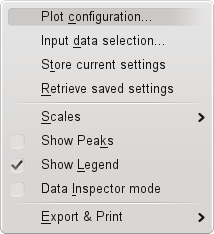
Right-clicking on an axis shows a context menu with options specific to that axis.
Zoom and pan
There are several ways of changing the scales interactively:
Zoom in and out by holding the right mouse button and moving the mouse. The mouse wheel can also be used. To zoom a specific axis, perform the action over that axis.
Pan (translate without scaling) by holding the middle mouse button and moving the mouse.
Use the small
Aicon on the bottom-left corner of the plot to reset the zoom and return to auto-scale mode.Access all scale settings from the axis submenus in the Use the TaurusPlot context menu.
Configure the plot
Open the plot configuration dialog from the Use the TaurusPlot context menu.
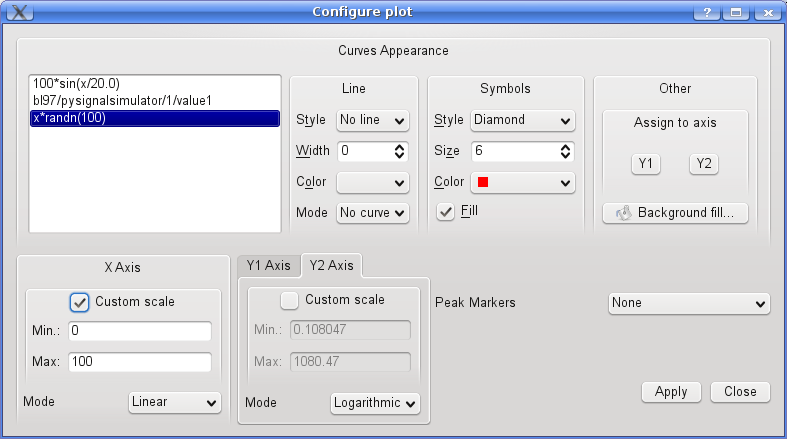
The top section can be used to customize the look of the displayed data, including line type, symbols, colors, thicknesses and associated axis. Changes are applied to all curves selected from the list on the left.
Curve titles can be changed by editing them directly in the list.
Choose what is plotted
When TaurusPlot is embedded in a GUI, some data may already be plotted.
To add other data, use the Model selection option from the
Use the TaurusPlot context menu.
Save and restore the current configuration
After customizing the plot, use the Save current settings option from the
Use the TaurusPlot context menu to save which curves are plotted and how they are
displayed.
Restore those settings using the retrieve current settings option from the
same context menu.
Inspect plotted values
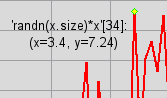
To inspect the value of a data point, enable Inspector mode from the Use the TaurusPlot context menu.
Export and print data
Use the export capabilities available from the Use the TaurusPlot context menu to export the plot to supported image and data formats.
Customize curve titles
Curve titles, which are displayed in the legend, can be customized in either of the following ways:
use the
Change Curves Titles...option in the Use the TaurusPlot context menu;use the Configure the plot, either by editing a curve name individually or by selecting several curves and using the
Curve Title(s)...button.
Use date/time values on the X axis
TaurusPlot can interpret X values as epoch timestamps. When launching the
standalone application, use the -x t option to enable this mode.
See Date/time support for the corresponding date/time model.